The values in the data model are accessed through the Data Selection panel; here, the Values tab exposes the measures in the data model, organized into logical folders. These measures represent the quantitative data in the data model.
Select Values
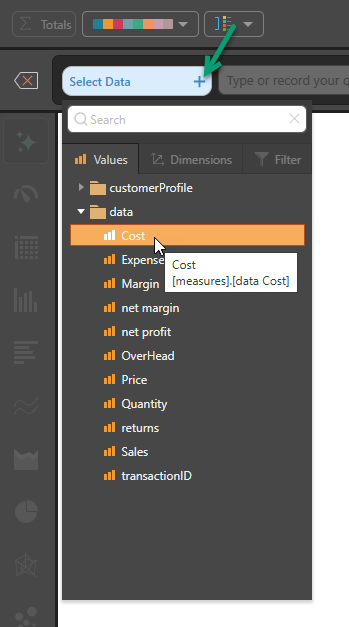
To build a discovery in Smart Discover, you must start by adding at least one measure from the Values tab. When you first access the Data Selection panel, only the Values tab is enabled.
Click Select Data + (green arrow below) to open the Data Selection panel:
Note: You can select any Custom Measures that you have access to from the Custom Measures folder at the bottom of the Values tree. The behavior is the same as for standard measures.
Selecting a Value
Open the folders in the Values tab to find the required measure and double-click the measure to add it to the discovery.
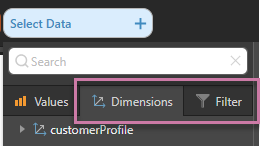
Once you have selected a first measure, the Dimensions and Filter tabs are also enabled. You can then continue adding more measures, along with hierarchies and filters, as required:
Search
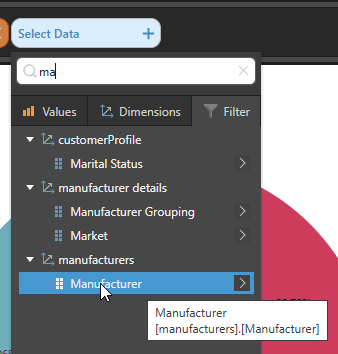
The Data Selections panel features a search bar, where you may enter a search term to look for required items on the open tab:
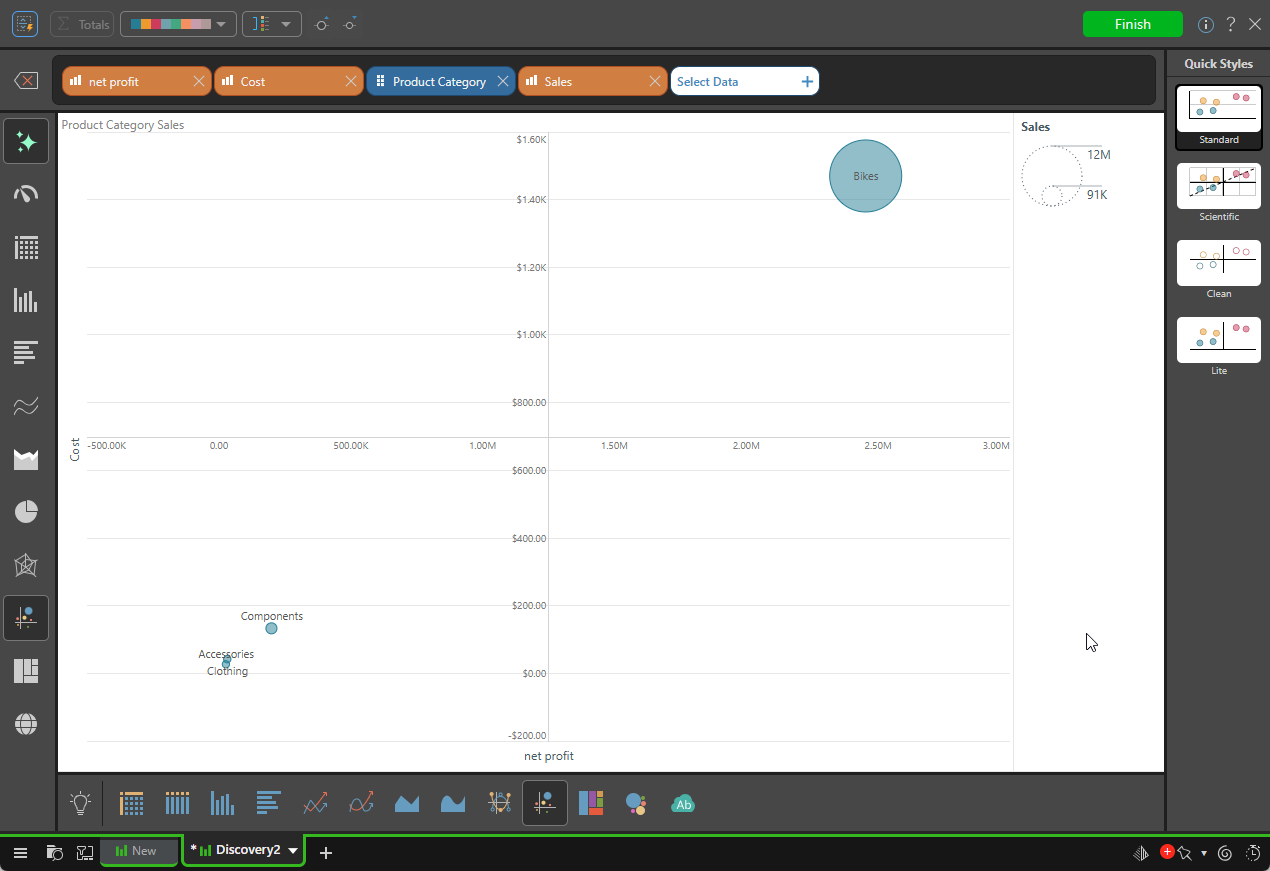
Example
In this example, three measures (Net Profit, Cost, and Sales) were added to create a bubble chart, with Net Profit on the x-axis, Cost on the y-axis, and Sales on the z-axis (driving the size of each bubble):